
Medium
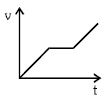
The acceleration-time graph for a body is shown in the graph. Which of the following graphs would probably represent the velocity of the body plotted against time?
- A
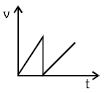
- B
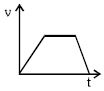
- C
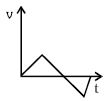
- D
Explore More
Similar Questions
The velocity-time graph of a body is shown in the figure. It implies that at point $B$
Medium
View SolutionThe accompanying graph of position $x$ versus time $t$ represents the motion of a particle. If $p$ and $q$ are both positive constants,the expression that best describes the acceleration $a$ of the particle is
The motion of an airplane is represented by a velocity-time graph as shown below. The distance covered by the airplane in the first $30.5 \ s$ is . . . . . . $km$.
What does a vehicle's speedometer measure: instantaneous velocity or instantaneous speed?
Medium
View SolutionThe $x-t$ graph of a particle moving along a straight line is shown in the figure. The speed-time graph of the particle is correctly shown by:
Medium
View SolutionVedclass Products
For Students
Vedclass Test Series
Mock tests in real JEE/NEET style with performance analysis. 5-day free trial.
Start Free TrialFor Teachers
Exam Paper Generator
Generate Set A/B/C/D exam papers from 7.5L+ questions in 2 minutes. 3 chapters free.
Try FreeFor Institutes
Online Exam Module
Live online exams with unlimited students, 360° analytics & white-label branding.
See Demo